
Orchestra Data Science is a visual flow programming interface in pure JavaScript that runs in Python Jupyter Notebooks. Orchestra enables a non-technical (or at least less technical) audience to work with big data, and eventually machine learning algorithms, without knowing Python syntax or paradigms. Complex programming and data-ingestion tasks such as deploying an API micro-service to munge live streaming data become possible without writing a single line of code. For expert users, it’s easy to “eject” and employ custom Python simultaneously.
Orchestra has two especially interesting areas technically.
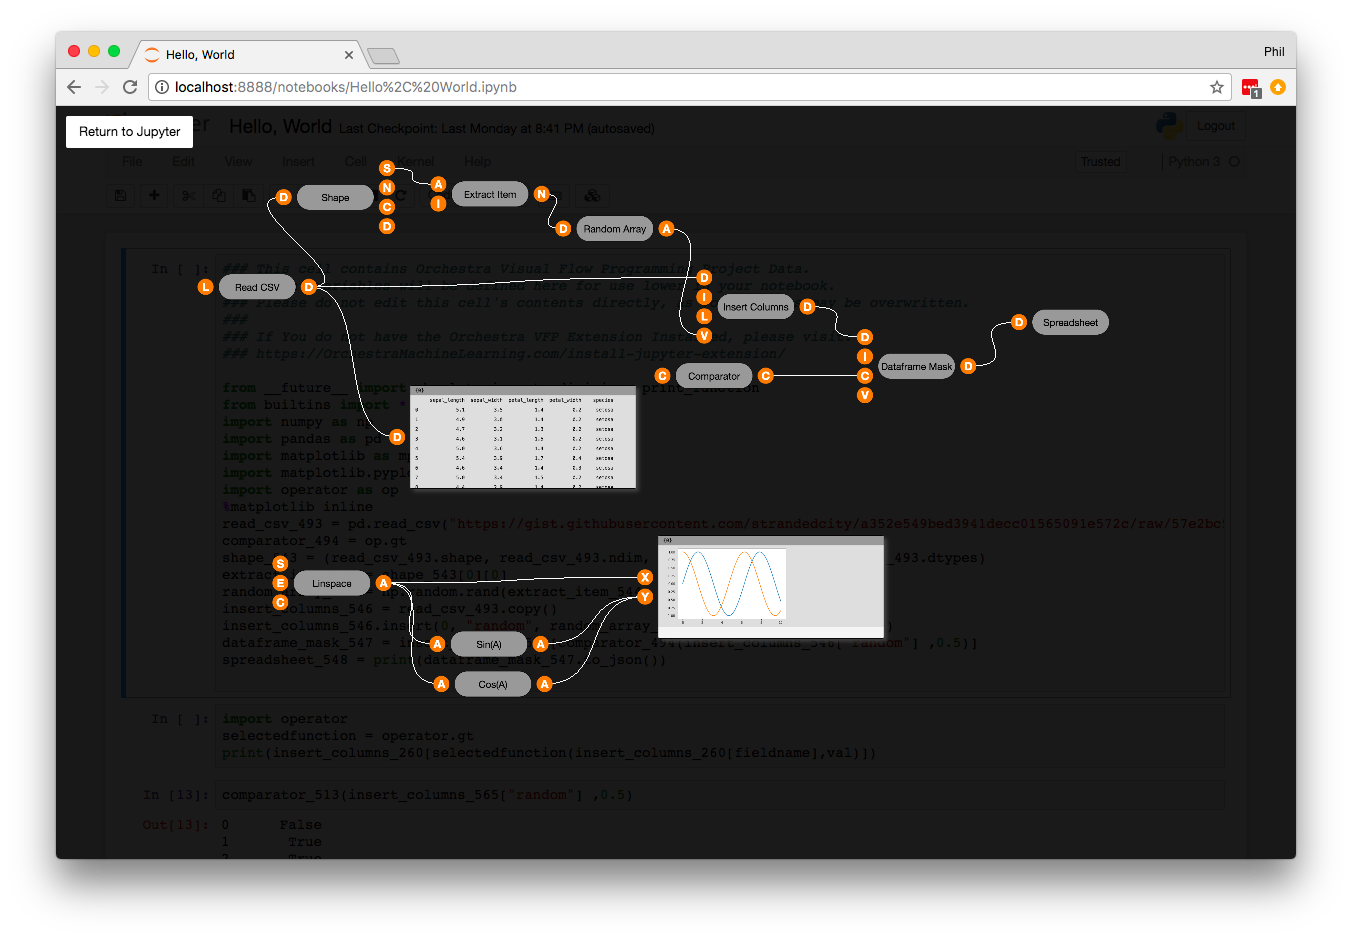
First, the workspace view. Proofs of concept using simple svg or canvas rendering showed that the curved wires connecting components became untenably slow for even very small Orchestra projects, perhaps with only a few dozen components in the workspace. So I switched to WebGL rendering, which enables me to zoom, animate, and selectively redraw wires performantly. However WebGL makes other display requirements harder. Simple CSS styling is helpful, but for a project where users need to read and type input text as well as trigger numerous browser-like interactions such as hover, click, and drag, writing everything in WebGL implied a step function in complexity, given the free stuff that comes with normal DOM elements and CSS.
Orchestra uses both simultaneously. A WebGL layer and CSS layer with normal DOM elements are superimposed, and controlled simultaneously by threejs. CSS transforms allow the HTML to zoom smoothly, while WebGL allows very large workspaces to render without performance hits.
Secondly, Orchestra tackles the challenging problem of tracking changes that occur anywhere inside the user-generated “graph” so it can understand (even without understanding Python) when components will require recalculation and updates. It does this using the idea of a “pulse” that propagates though the graph from any input that changes. As the pulse propagates, it counts the number of times it sees each component so that later, during the recalculation phase, components can ignore change events that would trigger duplicate calculations.
Documentation for the installation and use of Orchestra exists at the Github links below.
Dates: 2017 – Ongoing
Explorations: Superimposed DOM and WebGL zooming user interfaces; Graph mapping by “pulses” to prevent costly extra calculations
Technologies: JavaScript (Backbone, ThreeJS, RequireJS, Grunt), iPython, Jupyter Notebooks
Live Demo: Coming Soon (please enquire). Feel free to install it and follow the tutorials meanwhile!